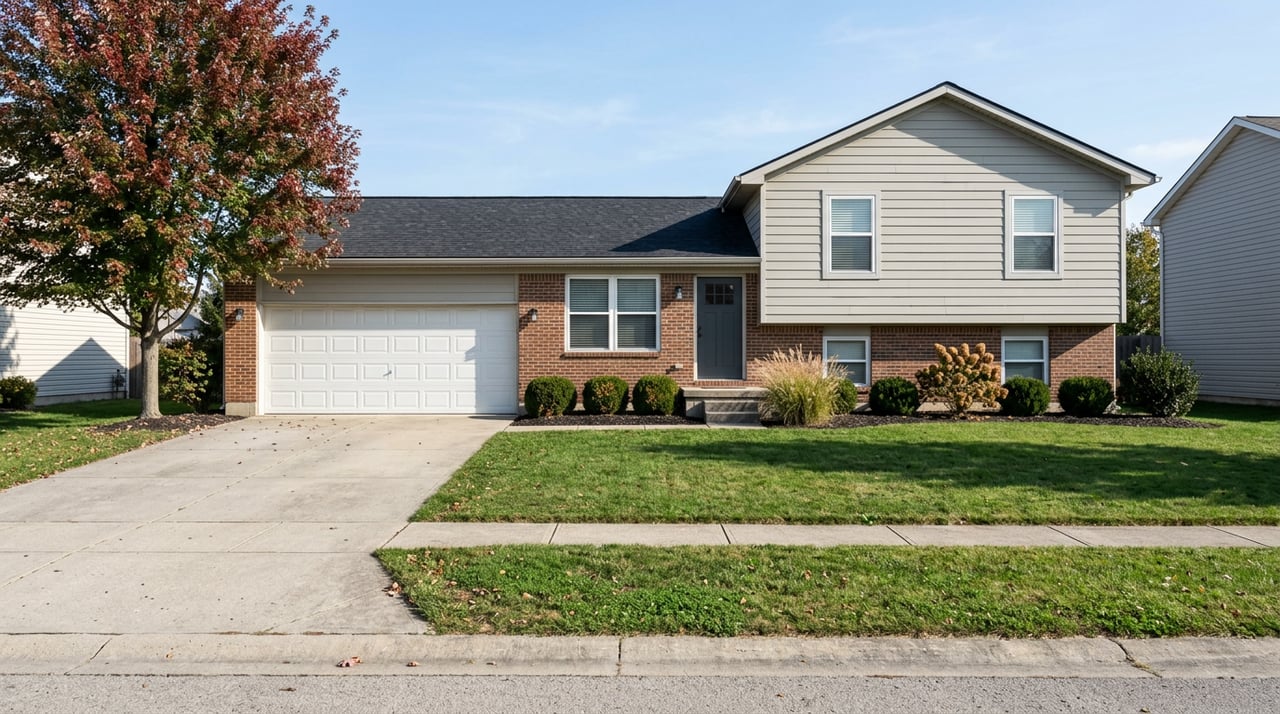
Trying to make sense of Cranberry Township’s housing numbers right now? You are not alone. Different sources show different trends, which can make planning your next move feel tricky. In this snapshot, you’ll see the latest prices, inventory, days on market, and what they mean for you as a buyer or seller. You’ll also get clear, practical steps to move forward with confidence. Let’s dive in.
Cranberry snapshot
- Median closed sale price: $410,000 (Feb 2026, Redfin)
- Typical home value (ZHVI): $463,316, up 5.2% year over year (through Feb 28, 2026, Zillow)
- Days on market: About 84 days (Feb 2026, Redfin) vs about 43 days (Dec 2025, Realtor.com)
- Sale-to-list ratio: About 97.8% (Feb 2026, Redfin) vs ~98% (Dec 2025, Realtor.com)
- Active listings: 82 homes (Feb 28, 2026, Zillow) vs 184 homes (Dec 2025, Realtor.com)
- Mortgage rates: 30‑year fixed averaged about 6.00% for the week ending Mar 5, 2026, and about 6.11% the week ending Mar 12, 2026, per Freddie Mac’s PMMS.
Each number is shown with the source and date because providers track different samples and timelines.
Why numbers differ
Closed sales vs value index
Closed-sale medians, like Redfin’s $410,000 in Feb 2026, reflect what actually closed in that month. Zillow’s ZHVI, at $463,316 and up 5.2% year over year through Feb 28, 2026, is an index that smooths values over time. That is why one measure can show softening while the other shows resilience. Both help, but they answer slightly different questions.
Price trends to watch
Redfin’s median closed price fell to $410,000 in Feb 2026, down 7.9% year over year. That points to lower realized prices on recent deals. Zillow’s value index rising 5.2% suggests broader stability across the housing stock. Realtor.com showed a $425,000 median in Dec 2025 on its charted series. When you evaluate a specific property, use these trends for context, then lean on a recent closed-sales analysis for your exact neighborhood and home type.
Inventory and new builds
Inventory looks wider than a year ago on some feeds. Realtor.com showed about 184 active listings in Dec 2025, while Zillow showed 82 as of Feb 28, 2026. Differences come from coverage and timing, but the direction suggests more choice for buyers. Redfin also reported 93 homes sold in Feb 2026, up 20.8% year over year, which can mean more activity at a range of price points.
New construction has been active in 2025–2026, adding single-family and townhome options across several price bands. More new-build supply can increase buyer choice and may bring incentives. Local infrastructure updates and township planning can influence timelines, so keeping an eye on Cranberry Township’s project updates is helpful when you are weighing location and future development.
Market speed and leverage
Redfin’s Feb 2026 median days on market was about 84, with an average sale coming in around 3% below asking. Realtor.com’s Dec 2025 snapshot showed a faster pace near 43 days and a sale-to-list ratio near 98%. The takeaway is simple. Well-priced, updated homes still sell near asking, while homes that need work or are mispriced take longer and invite negotiation. If you are buying, you likely have more room to negotiate on slower listings. If you are selling, pricing strategy and presentation matter more than ever.
What this means for you
First-time buyers
- Get fully pre-approved before you tour. With mortgage rates near 6% in early March 2026, your budget depends on the rate you lock.
- Watch for price-reduced homes and builder incentives. Longer days on market can open doors.
- Move quickly on updated, well-priced homes. Sale-to-list ratios near 98% mean strong listings still draw solid offers.
Move-up sellers
- Expect near-list outcomes when you price with the latest closed comps and present the home well.
- Longer market times and wider inventory in some feeds mean mispriced homes can sit. Staging, light repairs, and strong marketing pay off.
- If you will buy after selling, factor today’s rate into your trade-up math, and watch new-build competition in your price band.
Downsizers
- Demand for lower-maintenance options is supported by the growing mix of townhomes and smaller single-family homes.
- Capture equity by timing your listing into the spring uptick and pricing realistically against recent closed sales.
- If you need time to find the right next home, consider a leaseback or flexible closing terms during negotiations.
Local fundamentals
Cranberry Township’s population was estimated at about 35,004 as of July 1, 2024, and the median household income was about $125,532 on the latest multi-year estimate. The mean travel time to work is about 28.3 minutes, reflecting Cranberry’s role as both a commuter hub and local employment center. You can review these figures on U.S. Census QuickFacts for context as you plan.
Taxes and affordability
Property taxes are an important part of monthly cost. A 2025 ATTOM snapshot indicates an effective property tax rate of about 1.07% for Cranberry Township in that dataset. Local levies can change, so verify specifics for your property. Mortgage rates also shape buying power, and early March 2026 averages near 6% on the 30‑year fixed show why rate conversations are key. Track the weekly trend via Freddie Mac’s PMMS, then run updated payment scenarios with your lender.
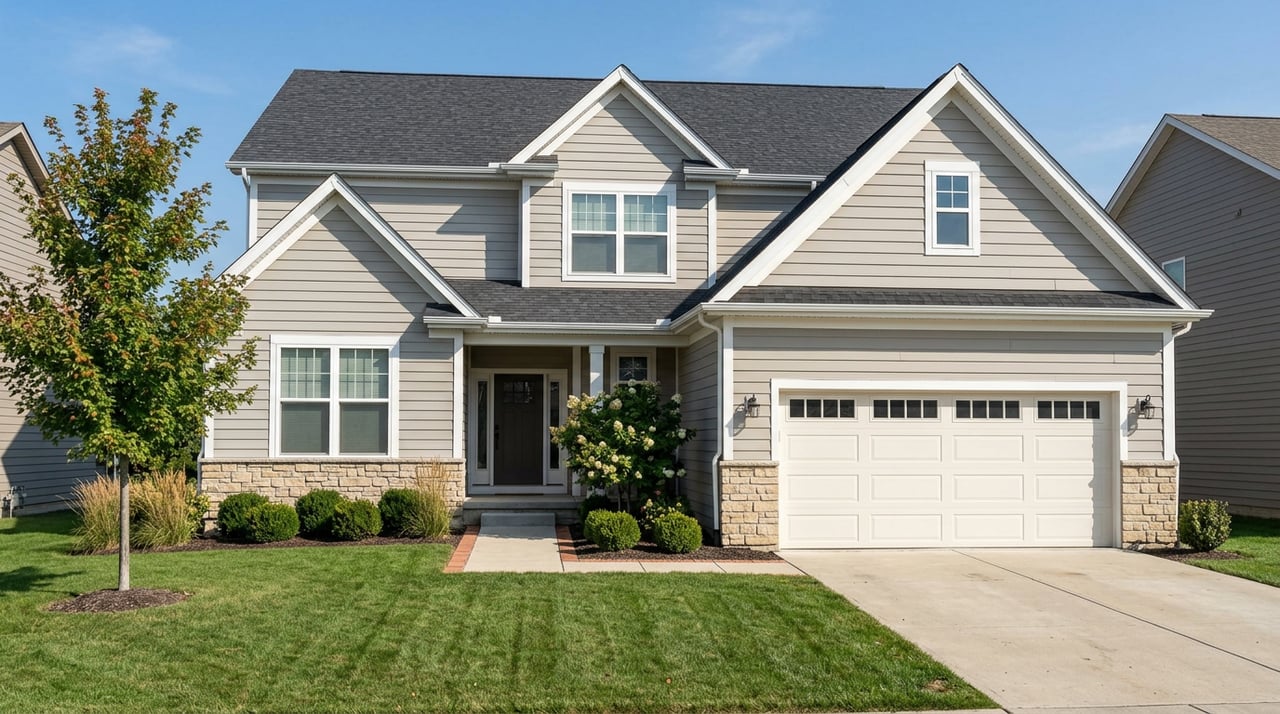
Price and search with precision
Portals provide helpful trends, but pricing or offering on a specific home calls for a current, hyperlocal analysis of the last 30–90 days of closed sales. Ask for a comparative market analysis that matches your home’s bed/bath count, condition, and micro‑location. If you are buying, define your top three must‑haves, then compare price per square foot trends for nearby communities to stretch value. If you are selling, pair data-driven pricing with strategic updates that maximize ROI, such as paint, lighting, and minor kitchen or bath refreshes.
Ready to map these numbers to your address or wish list? For a custom CMA, on-the-ground guidance, and a plan that fits your timeline, reach out to Pam Potts. Get Your Instant Home Valuation and a clear step-by-step path to your next move.
FAQs
What is the current median home price in Cranberry Township?
- The median closed sale price was about $410,000 in Feb 2026 (Redfin), while Zillow’s value index showed $463,316 through Feb 28, 2026, reflecting different methodologies.
How fast are homes selling in zip 16066 right now?
- Redfin showed a median of about 84 days on market in Feb 2026, while Realtor.com’s Dec 2025 snapshot showed about 43 days, due to different tracking windows.
Are sellers getting close to their asking price in Cranberry Township?
- Sale-to-list ratios were about 97.8% in Feb 2026 (Redfin) and near 98% in Dec 2025 (Realtor.com), indicating well-priced homes still sell near asking.
Is inventory rising in Cranberry Township and what does it mean for buyers?
- Some feeds show wider choice, with 184 listings in Dec 2025 (Realtor.com) and 82 in late Feb 2026 (Zillow); more supply can improve buyer leverage on slower listings.
How do current mortgage rates affect buying power in Cranberry Township?
- With the 30‑year fixed near 6% in early March 2026 per Freddie Mac’s PMMS, monthly payments are sensitive to even small rate changes, so rate locks and lender options matter.
What is a realistic pricing strategy for sellers in today’s market?
- Price against the most recent closed comps, invest in presentation, and plan for longer market times if you overshoot; well-presented homes can still land near asking.
How can I get the most accurate value for my home?
- Request a local CMA based on the last 30–90 days of closed sales for your micro‑area and property type, then adjust for condition and recent updates.